$Venture Global (VG.US)$April 23, 2025 📊 Overview Current price: $8.97 Daily change: +$0.37 (+4.30%) Intraday range: $8.68 – $9.41 Volume: 3,303,771 shares Market capitalization: $20.81 billion Beta: 2.45 (very high volatility compared to the market) --- 🗓️ Monthly Analysis Moving averages: 200 MA: $9.63 (the price is currently below it, indicating a long-term bearish trend) Technical indicators: RSI (14): 55.93 – in neutral territory, showing no extreme m...
6
4
Report
Keiith
:
Given that the long - term technical trend for Venture Global is bearish but short - term signals are bullish, how do you balance these conflicting indicators when deciding on an investment strategy?
Handiyanan
:
I really appreciate how comprehensive this analysis is. But I'm curious about how the author weights different factors when making an overall assessment. For example, are the legal disputes more of a concern than the competition in the long run?
Kevin Matte
OPKeiith
:
The long-term trend is down, but short-term signals are positive… what does that mean? It depends on your goal: If you’re a long-term investor, better wait until the stock clearly shows a real recovery (for example, if it breaks above $11.78 with strong volume). If you’re a short-term trader, you can take advantage of the current bounce, but do it carefully with a stop-loss and clear profit target. In short: short term = possible opportunity / long term = caution until confirmed.
Kevin Matte
OPHandiyanan
:
Are legal issues more serious than competition? Yes, right now, the lawsuits are the bigger concern—they can delay shipments, hurt reputation, and impact cash flow. Competition is more of a long-term risk, but Venture Global is already expanding and signing big contracts to deal with that. So for now, legal risks are more urgent, but competition is still important over the long run.
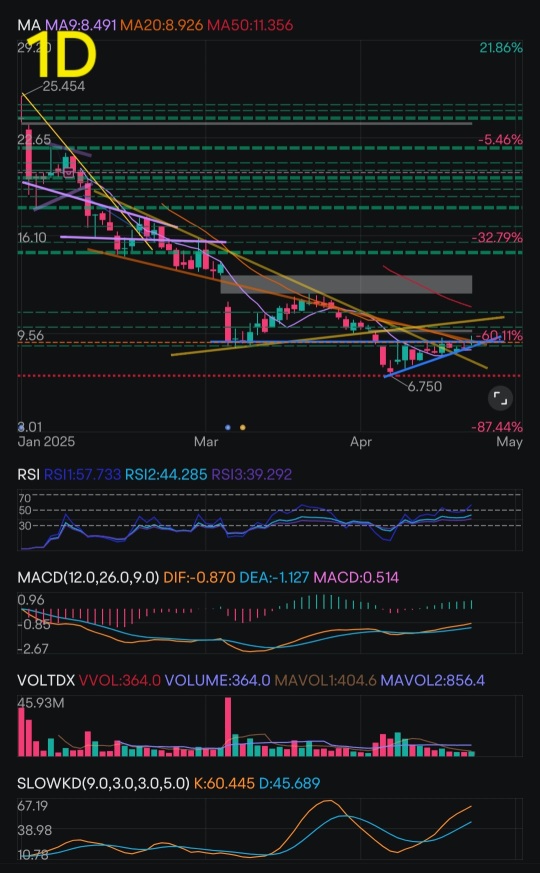
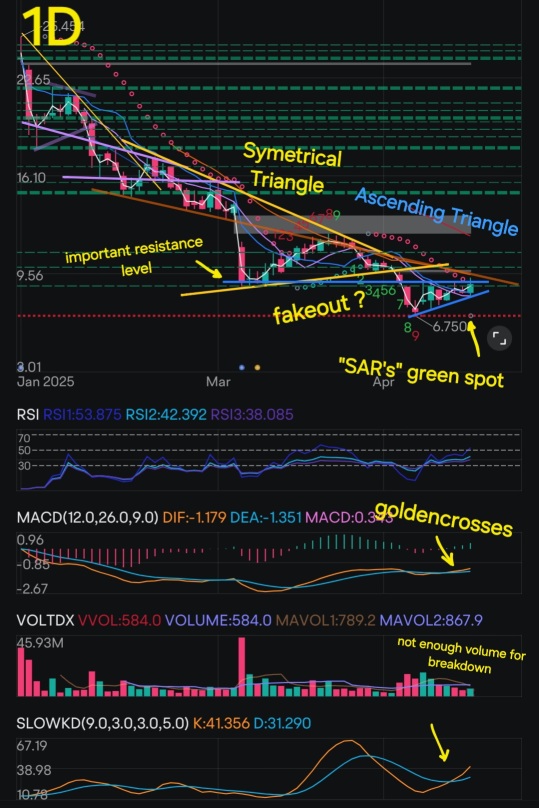
$Venture Global (VG.US)$ April 16, 2025 Multi-Timeframe Technical Analysis: 1. MULTI-TIMEFRAME STRUCTURAL CONTEXT Monthly: Since its IPO at $25, the stock has shown a strong bearish trend. No clear reversal structure has formed. The monthly chart shows a series of red candles with no significant rebound, indicating an ongoing distribution cycle. Weekly: The stock is evolving within a descending channel. Rebounds are consistently rejected ...
22
6
Report
Keiith
:
How are you handling the legal overhang from those arbitration cases?
Kevin Matte
OPKeiith
:
Thank you for your relevant comment. Indeed, the legal uncertainty surrounding the arbitration cases is a key risk factor that must be incorporated into any analysis of Venture Global. At this stage, I have treated this risk as a weighting factor in the valuation target, adjusting my pessimistic/neutral/optimistic scenarios accordingly: In the event of an unfavorable outcome, it could significantly increase costs and reduce the company’s self-financing capacity, impacting the applied valuation multiple. In the event of a favorable outcome or an amicable settlement, operational growth would largely offset this risk. My approach remains cautious, with active monitoring of legal developments to adjust future valuations as needed. I am also preparing a specific "Stress Test" scenario model related to the arbitration risks, to better frame this aspect. (I will be publishing this complementary analysis shortly.)
Kevin Matte
OPTliet
:
Excellent point, and thank you for highlighting it. Indeed, the fact that Plaquemines is already operating at 140% of its nominal capacity is an extremely bullish signal for Venture Global. Taking into account this overcapacity and the spot market dynamics projected for 2025, we arrive at a gross revenue potential of $12 billion USD — approximately four times the 2024 EBITDA, as you rightly pointed out. This suggests that the theoretical fair price based solely on current fundamentals (2024 sales) likely underestimates the company's future value if this scenario materializes. In my next update, I will incorporate this factor into a revised valuation model, using a forward-looking approach (forward P/S 2025 or EV/EBITDA 2025E). Thank you for your valuable contribution — it definitely strengthens the fundamental side of the analysis.
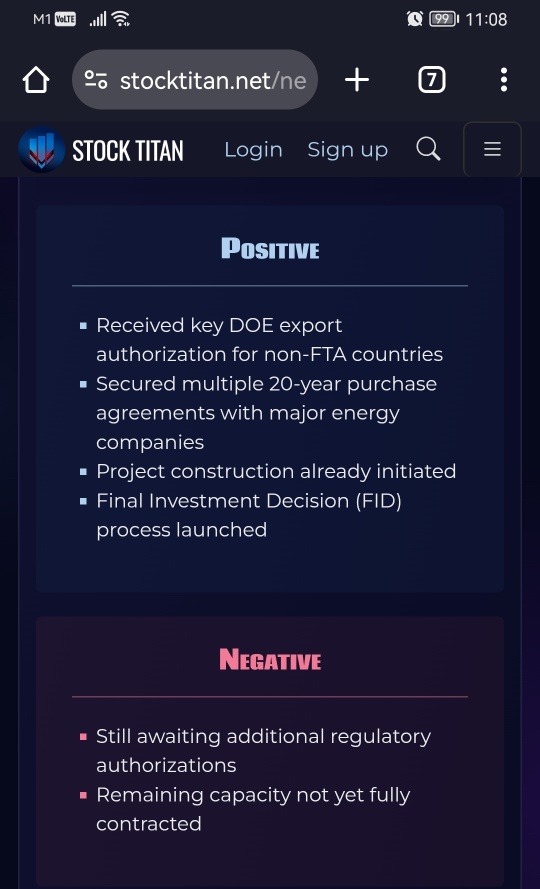
$Venture Global (VG.US)$April 3,2025 1. Commissioning of the Calcasieu Pass Terminal: A Strategic Milestone Venture Global LNG (VG) recently received approval from the Federal Energy Regulatory Commission (FERC) to begin service at the remaining facilities of its Calcasieu Pass liquefied natural gas (LNG) terminal in Louisiana. This authorization, announced on April 3, 2025, marks a major step toward the full-scale commercial launch of the site. In March 2025, ...
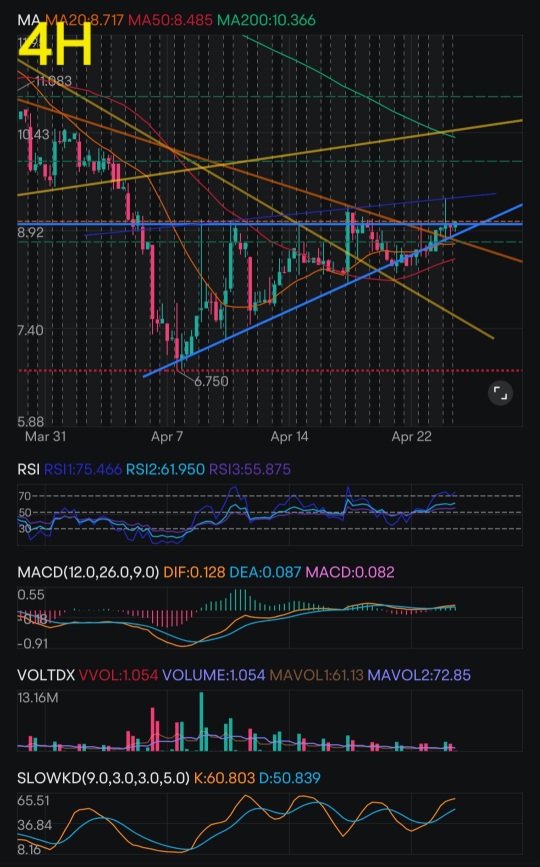
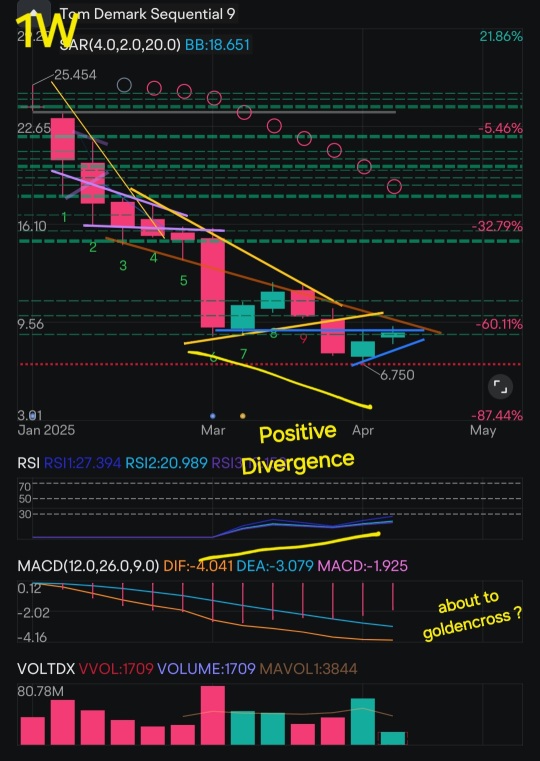
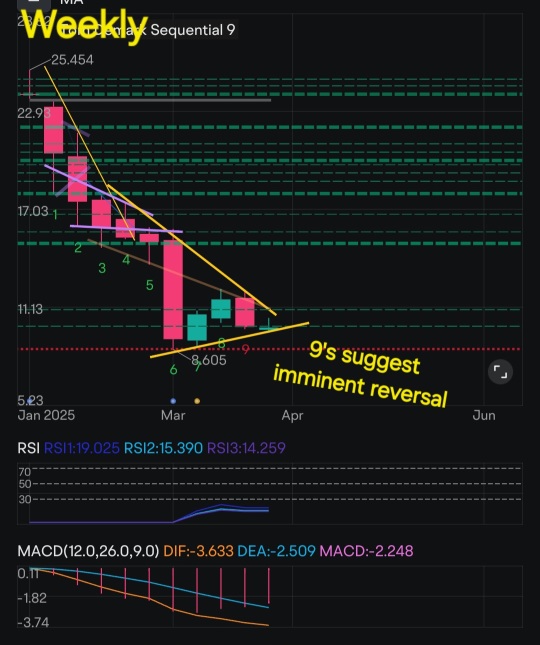
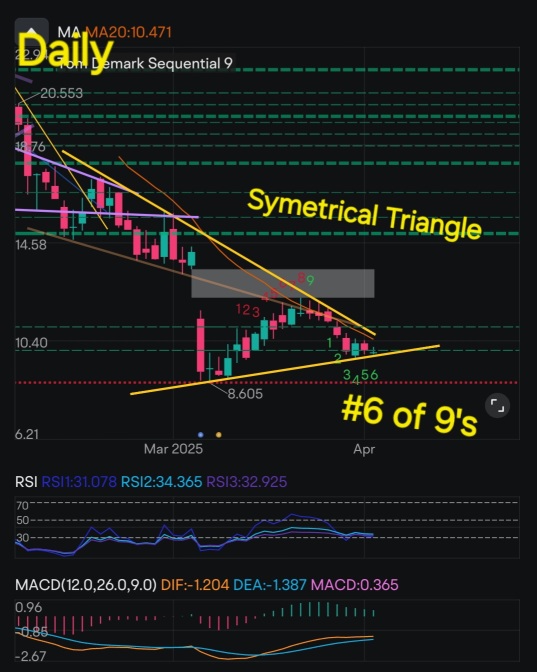
$Venture Global (VG.US)$Here is a brief summary of the bullish signals detected on the Weekly and Daily charts of Venture Global (VG) based on a multi-timeframe technical analysis: 1. Bullish Signals on the Weekly Chart: Tom DeMark Sequential 9 (Green TDS 9): The appearance of a green 9 indicates a signal of an imminent end to the bearish cycle (according to DeMark methodology). This suggests a high probability of a bullish reversal. Potential double bottom arou...
Kevin Matte
OPPTRGSNY
:
***Technical Analysis & Financial Analysis of UAVS*** 1. Multi-Timeframe Analysis: a. Long Term (Monthly Chart) General Trend: UAVS has been in a pronounced downtrend for several years, with lower highs and lower lows. Moving Averages (MA): 200MA: The price is well below the 200MA, indicating a dominant bearish trend. 50MA: Also above the current price, confirming long-term selling pressure. Key Support and Resistance: Support: Around $1.13, corresponding to the historical low reached in March 2025. Resistance: Around $2.50, a level previously tested without success. --- b. Medium Term (Weekly Chart) Trend: Continuation of the downtrend with increased volatility. Moving Averages: 50MA: The price remains below, signaling persistent weakness. 20MA: Recently tested as dynamic resistance but not convincingly broken. Trading Volume: Notable increase during price drops, suggesting active distribution. --- c. Short Term (Daily Chart) Immediate Trend: Slight consolidation after a significant drop. Moving Averages: 9MA: The price is fluctuating around this level, indicating market indecision. 20MA: Acting as immediate resistance. Support and Resistance: Support: $1.20, a psychological and technical level. Resistance: $1.35, matching the 20MA. --- 2. Technical Indicators a. RSI (Relative Strength Index) Current Value: Around 34.41, close to the oversold zone (<30). Interpretation: The stock is nearing oversold levels but not yet in a critical area. A move above 40 would be an early sign of recovery. --- b. MACD (Moving Average Convergence Divergence) Value: MACD at -0.13 with the signal line above, indicating a bearish momentum. Interpretation: No clear reversal signal until the MACD crosses above its signal line. --- c. Slow Stochastic (SlowKD) Value: K% at 20, D% at 25. Interpretation: Indicates oversold conditions, but a bullish crossover is needed to confirm a potential rebound. --- d. OBV (On-Balance Volume) Trend: Declining, confirming that volume is following the bearish trend. --- e. Bollinger Bands Observation: Price is near the lower band, suggesting a possible bearish extension or lateral consolidation. --- 3. Pattern and Price Structure Analysis Descending Triangles: Formation of descending triangles on the weekly chart, indicating potential trend continuation. Double Bottom: No clear pattern at this stage, a confirmed reversal is required. Bearish Channels: Well-defined descending channel, with limited technical rebounds within. --- 4. Volume and Liquidity Average Volume: Around 534,454 shares traded recently. Interpretation: Adequate liquidity for investors, but volume mainly follows bearish moves, suggesting dominant selling pressure. --- 5. Volatility Historical Volatility: High, with significant price swings over short periods. Implied Volatility: Not provided in the data, but likely high given recent price movements. --- 6. Scenarios and Probabilities Bullish Scenario (Short Term) Conditions: Confirmed breakout above the $1.35 resistance with increased volume. Target Price (TP): $1.50. Stop-Loss (SL): $1.15. Probability: 30%. --- 1. Support and Resistance Zones Immediate Support: Around $1.22, corresponding to the recent low. Immediate Resistance: Around $1.36, a level previously tested without success. --- 2. Volume and Money Flow Trading volume has shown an upward trend during bearish movements, suggesting dominant selling pressure. Money flow also indicates net capital outflows, reflecting a decline in investor interest. --- 3. Trader Sentiment The overall trader sentiment toward UAVS is negative, influenced by weak financial fundamentals and a declining stock performance. Forums and specialized media reflect increased caution, with little enthusiasm for long positions. --- 4. Short Interest, Short Squeeze Potential, and Borrowing Cost Short Interest: Approximately 4.96% of total float, representing 548,230 shares as of March 14, 2025. Borrowing Cost: The borrow fees for short selling UAVS are relatively low, indicating sufficient availability of shares for short positions. Short Squeeze Probability: Low, due to the moderate short interest and absence of positive catalysts likely to trigger a massive short covering. --- 5. Bullish and Bearish Scenarios Short-Term (1 to 3 months) Bullish Scenario: Conditions: A confirmed breakout above the $1.36 resistance level with significantly increased volume. Target Price (TP): $1.50 Stop-Loss (SL): $1.15 Estimated Probability: 30% Bearish Scenario: Conditions: Sustained price below $1.22 with high volume. Target Price (TP): $1.10 Stop-Loss (SL): $1.30 Estimated Probability: 70% --- Long-Term (6 to 12 months) Bullish Scenario: Conditions: Improvement in financial fundamentals and positive announcements from management. Target Price (TP): $2.00 Stop-Loss (SL): $1.00 Estimated Probability: 20% Bearish Scenario: Conditions: Continued financial losses and lack of positive catalysts. Target Price (TP): $0.80 Stop-Loss (SL): $1.30 Estimated Probability: 80%
Kevin Matte
OPPTRGSNY
:
***Financial Analysis*** 1. General Context and Current Situation AgEagle Aerial Systems (NASDAQ: UAVS) operates in the drone technology sector—a structurally growing market driven by demand for automation, surveillance, precision agriculture, logistics, security, and defense. However, the company has experienced a major deterioration in its financial position and a strategic misalignment in recent years. --- 2. Revenue and Growth (Income Statement) Based on the provided data: Annual Revenues: After impressive growth between 2020 and 2022 (+333% in 2020, +659% in 2021, +95% in 2022), revenue dropped -28% in 2023, falling from $19.09M to $13.74M. Quarterly Revenues: Q1 2024 shows a temporary rebound at $3.89M, but this momentum collapses by Q2 and Q3 2024, falling to $3.28M (YoY -5.71%). Sectoral Analysis: This volatility highlights UAVS’s difficulty in sustaining long-term organic growth despite strong post-COVID traction (fueled by agricultural and autonomous logistics needs). --- 3. Margins (Gross, Operating, Net) Net Margin: Extremely degraded, reaching -308.71% in 2023, a slight improvement vs 2022 (-305.08%) but still catastrophic. Quarterly margins range from -838% in Q4 2023 to -105% in Q3 2024. Operating Margin: Also negative, at -$17.39M in 2023, with YoY improvement (+22.99%), but still far from operational profitability. Gross Margin: Not shown in the screenshots, but the severely negative operating and net margins suggest poorly managed fixed and operational costs, potentially pointing to an unviable business model. --- 4. Profitability: ROE, ROA, ROIC All profitability metrics are negative: ROE (Return on Equity): Not explicitly provided, but the equity ratio dropped from 89% (2019) to 28% (Q3 2024), suggesting a rapid erosion of shareholder equity. ROA (Return on Assets): Likely negative, given the net loss of -$42M versus $25M in assets. ROIC (Return on Invested Capital): Impossible to turn positive in this environment; capital invested continues to generate recurring losses. --- 5. Cash Flows Free Cash Flow (FCF) Annual: Negative since 2019, hitting a low of -$21.5M in 2022, and “improving” to -$11.73M in 2023. Quarterly: Slight improvement, with reduced losses to -$1.09M in Q3 2024, a YoY improvement of +50%. Cash Flow from Operations (CFO) Annual: Still negative, -$10.96M in 2023, but improving (+44% YoY). Interpretation: The company is structurally burning cash, though signs of effort to slow the bleeding have emerged since 2023.
$Venture Global (VG.US)$🔹️Analysis of Investor Sentiment and Consequences of the Decline in Natural Gas Prices 1️⃣ 1. Investor Sentiment Investor sentiment in the natural gas market is currently negative, mainly due to the following factors: Overproduction and excess supply: U.S. natural gas production has reached record levels, putting downward pressure on prices. Weather conditions unfavorable to demand: Forecasts in...
13
1
1
Report
TWIMO (151403908)
:
Despite mostly motherhood statements, this is a mightily detailed analysis covering most aspects of how price is impacted…. Terrific!!
U.S leading technology companies with strong market presence, influential in their industries, and notable for robust innovation and profitability. Information is provided by Futu and is a non-exhaustive list of all thematic stocks for reference purposes only.
This section presents the top 5 stocks in U.S Tech Companies, ranked from highest to lowest based on real-time market data. U.S leading technology companies with strong market presence, influential in their industries, and notable for robust innovation and profitability. Information is provided by Futu and is a non-exhaustive list of all thematic stocks for reference purposes only.
This section presents the top 5 stocks in U.S Tech Companies, ranked from highest to lowest based on real-time market data.


Keiith : Given that the long - term technical trend for Venture Global is bearish but short - term signals are bullish, how do you balance these conflicting indicators when deciding on an investment strategy?
Handiyanan : I really appreciate how comprehensive this analysis is.
But I'm curious about how the author weights different factors when making an overall assessment. For example, are the legal disputes more of a concern than the competition in the long run?
Kevin Matte OP Keiith : The long-term trend is down, but short-term signals are positive… what does that mean?
It depends on your goal: If you’re a long-term investor, better wait until the stock clearly shows a real recovery (for example, if it breaks above $11.78 with strong volume).
If you’re a short-term trader, you can take advantage of the current bounce, but do it carefully with a stop-loss and clear profit target. In short: short term = possible opportunity / long term = caution until confirmed.
Kevin Matte OP Handiyanan : Are legal issues more serious than competition? Yes, right now, the lawsuits are the bigger concern—they can delay shipments, hurt reputation, and impact cash flow. Competition is more of a long-term risk, but Venture Global is already expanding and signing big contracts to deal with that.
So for now, legal risks are more urgent, but competition is still important over the long run.