5AEPollux Prop
0.0200.002+11.11%600.80K11.11K0.0180.0180.0200.01855.19M4.66M2.76B232.92M+11.11%-4.76%-4.76%-4.76%-9.09%-39.39%-9.09%--0.26%0.000.0011.11%Real Estate
BJVYamada Green Res
0.1170.005+4.46%200.0023.000.1170.1120.1170.11720.65M4.82M176.52M41.19M+1.74%-7.87%-2.50%+7.34%-15.83%-25.74%-6.40%--0.00%LossLoss0.00%Real Estate
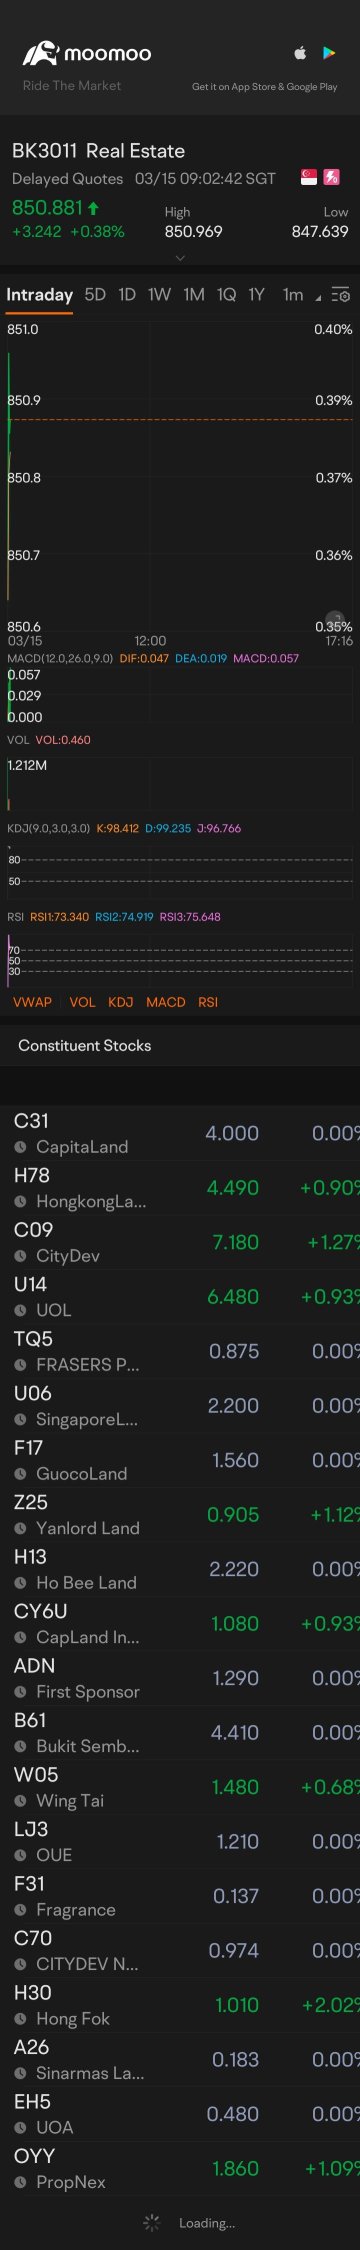
H78HongkongLand USD
4.8900.190+4.04%7.05M34.18M4.7104.7004.9204.70010.78B5.03B2.21B1.03B+15.60%+20.15%+7.47%+16.89%+2.72%+61.09%+14.26%4.50%0.69%LossLoss4.68%Real Estate
CLNAPAC Realty
0.4100.015+3.80%191.60K78.41K0.3950.3950.4150.395147.27M36.17M359.20M88.22M+4.37%+11.23%-0.55%-5.02%+9.79%+2.87%+9.79%5.61%0.22%20.5020.505.06%Real Estate
9CICapitaLandInvest
2.7500.070+2.61%18.04M49.08M2.6802.6802.7502.67013.72B6.28B4.99B2.28B+3.38%+10.44%+0.36%+13.64%-5.50%+8.27%+4.96%4.36%0.79%29.2629.262.99%Real Estate
1F3Aspen
0.0430.001+2.38%457.60K19.67K0.0430.0420.0430.04346.58M18.94M1.08B440.49M-4.44%+10.26%-8.51%-10.42%-2.27%-14.00%-14.00%--0.10%14.334.300.00%Real Estate
41OLHN
0.4700.010+2.17%375.20K175.14K0.4650.4600.4700.460196.59M75.71M418.27M161.09M-1.05%+11.90%+4.73%-6.44%+40.34%+55.65%-3.69%4.26%0.23%4.094.092.17%Real Estate
T24Tuan Sing
0.2500.005+2.04%170.80K41.85K0.2450.2450.2500.245307.54M117.58M1.23B470.31M-1.96%+4.17%-10.71%-9.09%0.00%+2.88%-7.41%2.80%0.04%125.00125.002.04%Real Estate
BTEBund Center
0.3700.005+1.37%18.00K6.39K0.3550.3650.3700.355280.74M41.96M758.77M113.40M+5.71%+5.71%-3.90%-2.63%-4.31%-5.49%-3.90%3.78%0.02%20.5620.564.11%Real Estate
B61Bukit Sembawang
3.5400.040+1.14%25.60K90.10K3.4903.5003.5403.490916.55M514.42M258.91M145.31M+2.31%+4.12%-1.67%0.00%-1.39%+10.66%-0.56%1.13%0.02%8.4512.921.43%Real Estate
CY6UCapLand India T
0.9750.010+1.04%2.57M2.50M0.9750.9650.9800.9651.32B1.08B1.35B1.11B+3.72%+5.98%+1.56%-2.39%-7.77%+3.94%-6.04%6.87%0.23%2.972.971.55%Real Estate
C09CityDev
4.9700.050+1.02%1.35M6.69M4.9404.9204.9704.9004.44B1.68B893.40M337.04M+1.43%+8.52%+0.40%-1.39%-4.42%-16.15%-2.74%1.61%0.40%23.3323.331.42%Real Estate
H30Hong Fok
0.7350.005+0.68%685.50K510.41K0.7300.7300.7550.730602.18M203.42M819.30M276.76M+3.52%+6.52%-4.55%-7.55%-11.45%-11.44%-10.37%1.36%0.25%19.8619.863.43%Real Estate
U14UOL
5.7700.020+0.35%1.38M7.95M5.7405.7505.7705.7104.88B1.84B844.94M319.39M+0.17%+3.59%-1.87%+14.48%+6.07%+1.94%+11.82%2.60%0.43%13.6113.611.04%Real Estate
C70CITYDEV NCCPS
0.9880.0000.00%0.000.000.0000.9880.0000.000882.68M332.99M893.40M337.04M-1.20%+0.71%+0.82%-1.69%+1.78%+2.72%-1.00%--0.00%0.000.000.00%Real Estate
W05Wing Tai
1.1700.0000.00%79.40K92.74K1.1701.1701.1801.160892.62M331.73M762.93M283.53M+3.54%+4.46%-2.50%-4.88%-11.36%-19.12%-5.65%2.56%0.03%LossLoss1.71%Real Estate
UV1Regal Intl
0.1150.0000.00%0.000.000.0000.1150.0000.00025.87M25.13M224.92M218.53M+4.55%+15.00%+13.86%+4.55%-15.44%+666.67%+49.35%--0.00%Loss7.670.00%Real Estate
U06SingaporeLandGrp
2.0000.0000.00%16.60K33.13K2.0002.0002.0001.9902.87B322.41M1.43B161.20M+1.52%+6.38%+0.50%+6.95%+12.36%+13.64%+13.64%2.00%0.01%10.1010.100.50%Real Estate
TQ5Frasers Property
0.8150.0000.00%105.10K84.96K0.8100.8150.8150.8053.20B342.98M3.93B420.84M+0.62%+7.24%-1.81%-5.78%-5.94%+7.00%-7.96%5.52%0.03%19.4019.401.23%Real Estate
S9BAmcorp Global
0.1150.0000.00%0.000.000.0000.1150.0000.00051.45M5.08M447.40M44.22M0.00%0.00%-0.86%0.00%-4.17%-25.81%0.00%--0.00%LossLoss0.00%Real Estate
S2DTosei
9.5000.0000.00%0.000.000.0009.5000.0000.000460.38M460.38M48.46M48.46M+0.00%+0.00%+0.00%+0.00%+0.00%+0.00%+0.00%7.46%0.00%3.744.300.00%Real Estate
PH0Hatten Land
0.0110.0000.00%0.000.000.0000.0110.0000.00020.43M6.61M1.86B601.16M-8.33%0.00%-8.33%-15.38%-26.67%-38.89%-31.25%--0.00%LossLoss0.00%Real Estate
P36Pan Hong
0.0940.0000.00%0.000.000.0000.0940.0000.00048.16M15.11M512.31M160.71M+2.17%+9.30%+10.59%+34.29%+42.42%-16.07%+10.59%--0.00%23.508.550.00%Real Estate
H13Ho Bee Land
1.8000.0000.00%6.60K11.88K1.8001.8001.8001.8001.20B240.97M664.02M133.87M0.00%+1.12%0.00%-1.10%-8.16%-5.27%-1.64%1.67%0.01%10.9110.910.00%Real Estate
F86MYP
0.0400.0000.00%131.10K5.24K0.0400.0400.0400.04063.70M6.46M1.59B161.61M0.00%-11.11%-13.04%-16.67%-16.67%+5.26%-20.00%--0.08%LossLoss0.00%Real Estate
F1ELow Keng Huat
0.3000.0000.00%100.0030.000.3000.3000.3000.300221.64M49.68M738.82M165.60M-3.23%0.00%-10.45%-4.76%-9.09%-4.31%-4.76%5.00%0.00%100.00100.000.00%Real Estate
EH5UOA
0.4200.0000.00%0.000.000.0000.4200.0000.000700.18M55.44M1.67B131.99M-7.69%-19.23%-7.83%-0.12%-8.10%-24.15%-14.29%5.00%0.00%8.948.940.00%Real Estate
CTOHong Lai Huat
0.0510.0000.00%0.000.000.0000.0510.0000.00026.41M11.04M517.84M216.50M-5.56%-1.92%0.00%-12.07%+59.38%-10.53%-16.39%--0.00%LossLoss0.00%Real Estate
C33Chuan Hup
0.1600.0000.00%89.30K14.29K0.1600.1600.1600.160146.37M57.55M914.79M359.70M+3.23%+6.67%+4.58%0.00%-0.83%-3.10%+2.56%6.25%0.03%40.0053.330.00%Real Estate
BTFDebao Property - watch list
0.1280.0000.00%0.000.000.0000.1280.0000.0009.60M9.28M75.00M72.52M-27.76%-31.04%-31.04%+5.35%-43.81%+126.42%-34.04%--0.00%LossLoss0.00%Real Estate